Over-engineering the monitoring of my internet bandwidth usage
͎a̧͈͖r̽̾̈́͒͑e not rè̑ͧ̌aͨl̘̝̙̃ͤ͂̾̆ ZA̡͊͠͝LGΌ ISͮ̂҉̯͈͕̹̘̱ TO͇̹̺ͅƝ̴ȳ̳ TH̘Ë͖́̉ ͠P̯͍̭O̚N̐Y̡ H̸̡̪̯ͨ͊̽̅̾̎Ȩ̬̩̾͛ͪ̈́̀́͘ ̶̧̨̱̹̭̯ͧ̾ͬC̷̙̲̝͖ͭ̏ͥͮ͟Oͮ͏̮̪̝͍M̲̖͊̒ͪͩͬ̚̚͜Ȇ̴̟̟͙̞ͩ͌͝S̨̥̫͎̭ͯ̿̔̀ͅBackground and the Initial Solution
Almost 9 years ago my monthly bandwidth cap on my home internet connection was 750GB up + down, a lot lower than it is now (in fact it's unlimited now, making all of this even more ridiculous). I can recall that it was as low as 400GB at one point as well. At that time the overage charges were pretty nasty too; $1-$5/GB or something.
Suffice it to say, I am a heavy bandwidth user and so are the people I live with so it became a ritual for me to start checking the bandwidth meter page to see if I needed to reign things in.
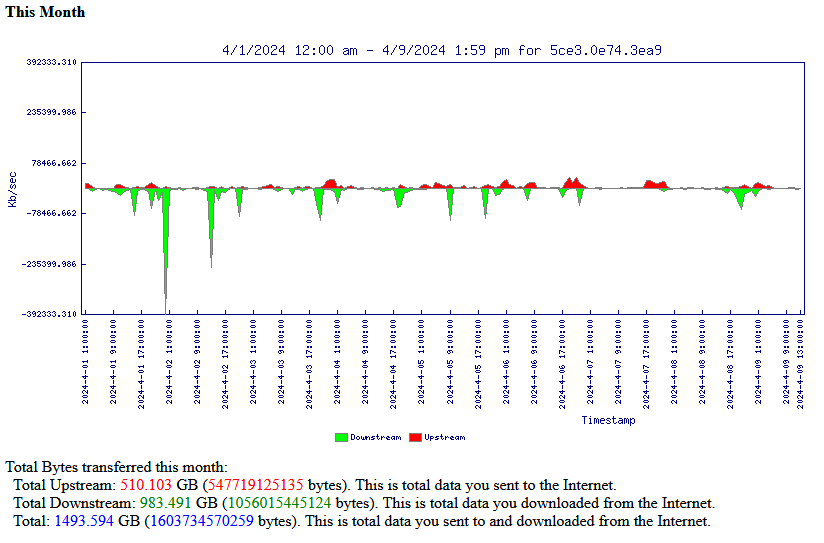
Doing this manually got old, and in October of 2015 I came up with a plan to automate collecting this information and sending alerts to my email using Google sheets and Google Apps Scripts.
The basic idea was:
- Fetch page source
- Parse bandwidth values
- Log this information to a sheet
- Run some alert logic (initially this was an e-mail to my G-mail inbox)
At this point in time I was already familiar with doing items 1, 3, and 4 using Google Apps Scripts and Google Sheets. So I spent some time experimenting to determine the "best" way to parse these values out of the HTML source code of the bandwidth page. There were 3 significant iterations and reading through my comments just now has been a source of great amusement.
Mk.I
/**
Creates a DOM tree to locate current months data underneath the first graph on the page.

Xml.parse is deprecated so..... Not for the faint of heart.
*/
function xmlDerps(html) {
  //@TODO: This can probably be redone more intelligently
  var doc = Xml.parse(html, true); //Mmmmm deprecation
  var bodyHtml = doc.html.body.toXmlString();
  doc = XmlService.parse(bodyHtml);
  var root = doc.getRootElement();

  //This is kind of kludgy; the html doesn't give us much to distinguish the <p> tags with though
  //hopefully the current month <p> tag remains the third one on the page
  var currentMonthRoot = getElementsByTagName(root, 'p')[2]

  //Get all child tags of our <p> that are <font> tags
  var fontChilds = getElementsByTagName(currentMonthRoot, 'font')

  var up = 0
  var down = 0
  var tot = 0

  //Should be 6 font tags total
  for each (f in fontChilds) {
    var fl = parseFloat(f.getText()) //Cast value to a float for comparisons
    var cl = f.getAttribute('style') //Load font attribute 'style' for checking text color

    if(fl < 2000 && cl.getValue().indexOf("color: red") > -1) {
      up = fl
    }
    if(fl < 2000 && cl.getValue().indexOf("color: green") > -1) {
      down = fl
    }
    if(fl < 2000 && cl.getValue().indexOf("color: blue") > -1) {
      tot = fl
    }
  }
  return [up, down, tot]
}
This is somehow worse than using regex... good lord
Mk.II
/**
Uses regex and String.search() to pull current month's data out of the history table at the bottom
of the page.
*/
function regexDerps(html) {
  var months = ["\\January", "\\February", "\\March", "\\April", "\\May", "\\June", "\\July", "\\August", "\\September", "\\October", "\\November", "\\December"];

  //Locate first instance of CURRENT_MONTH, CURRENT_YEAR ex: "October, 2015"
  var dateString = months[(new Date()).getMonth()]
  dateString += ', ' + (new Date()).getFullYear()
  var i = html.search(dateString)

  //Locate first instance of LAST_MONTH, CURRENT_YEAR ex: "September, 2015"
  dateString = months[(new Date()).getMonth()-1]
  dateString += ', ' + (new Date()).getFullYear()
  var j = html.search(dateString)

  if(j == -1) {
    j = html.length //If for whatever reason last month's data isn't in the table...
  }

  html = html.substring(i, j) //Slice out just the section with the data we want

  /**
  Lucky for us PTD color codes up, down, and total as red, green, and blue respectively.
  We can use that to isolate the data we want.
  */
  var red = html.substring(html.search('color: red') + 12)       // +12 because "color: red'>" is 12 characters long
  var green = html.substring(html.search('color: green') + 14)   // +14 because "color: green'>" is 14 characters long
  var blue = html.substring(html.search('color: blue')+ 13)      // +13 because "color: blue'>" is 13 characters long

  //Our values are at the begining of these string now with a bunch of garbage after them
  //Substring from 0 to the next occurence of "<" to trim out what we want
  red = red.substring(0, red.search('<'))
  green = green.substring(0, green.search('<'))
  blue = blue.substring(0, blue.search('<'))

  return [parseFloat(red), parseFloat(green), parseFloat(blue)]
}
I had begun experimenting with regex at this point... this solution is truly half-baked
Mk.III
/**
Used a proper regex to parse the html in ~10 lines.

This should be faster and more reliable than previous parsing methods as well as more resistant to page restructuring; as
long as the <h4> tag and the 3 <font> tags remain on the page in the same order of appearance this will not break.
*/
function regexDerpsv2(html) {
  html = html.replace(/\r?\n|\r/g,""); //remove newlines because I cbf to rewrite the pattern below
  var re = /<h4>This Month.+?<font style='color: red'>([-+]?[0-9]*\.?[0-9]+).+?<font style='color: green'>([-+]?[0-9]*\.?[0-9]+).+?<font style='color: blue'>([-+]?[0-9]*\.?[0-9]+)/;
  var m;
  if ((m = re.exec(html)) !== null) { //Did we find a match?
      if (m.index === re.lastIndex) { //I don't know what this does lul...
          re.lastIndex++;
      }
      //upstream, downstream, and total values are defined in the regex as the 1st, 2nd, and 3rd capture groups
      return [parseFloat(m[1]), parseFloat(m[2]), parseFloat(m[3])]
  }
  return [-1, -1, -1]
}
By this iteration I had finally grokked enough regex concepts to do this somewhat elegantly...
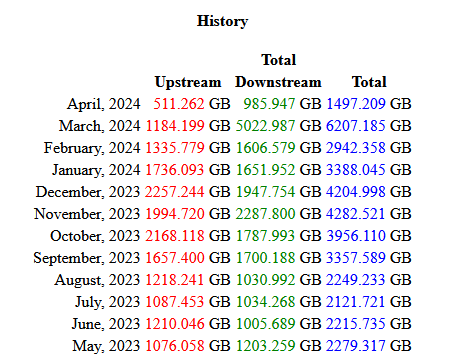
I don't have any record of when I put this version of the code into use but I know that it ran without modification for at least 5 years, probably longer. We have the fact that the cable company's bandwidth utility hasn't been updated in at least that long to thank for that more than anything. You know what they say about parsing HTML using regular expressions... However, the HTML source of the page is quite minimal/simplistic and hasn't changed at all in almost 10 years as of this writing.
Disaster Strikes
Almost 8 years later, to the day, on October 13, 2023 the cable company made a policy change somewhere and it is no longer possible to access the bandwidth tool from outside of their network. This means my Google App Scripts code can no longer fetch the data on it's own.
By this point the monthly cap had already been raised to 6000GB/month and subsequently removed altogether, so I really wasn't in need of the alerts I had configured anymore. I could write some code to run on my server to pull the data and then somehow send it to the Google sheet (in fact, I am doing this now) but since there wasn't really an immediate need anymore I let it go stale for a few months...
Back in Black
I was working on a different project and realized how simple it is to configure a webhook you can send a POST request to in order to insert data into a Google Sheet and so I set out to revive the bandwidth tracker. I don't particularly need to worry about it anymore but it is fun data to log.
Within the code on the Google Sheet side of things I needed a doPost() function. Like so:
function doPost(e) {
  var postData = JSON.parse(JSON.parse(e.postData.contents));

  //Grab data from payload
  upstream = parseFloat([postData[0]]);
  downstream = parseFloat([postData[1]]);

  //pass it to legacy main function to process update
  update(upstream, downstream)

  return ContentService.createTextOutput("Data inserted into sheet successfully!").setMimeType(ContentService.MimeType.TEXT);
}
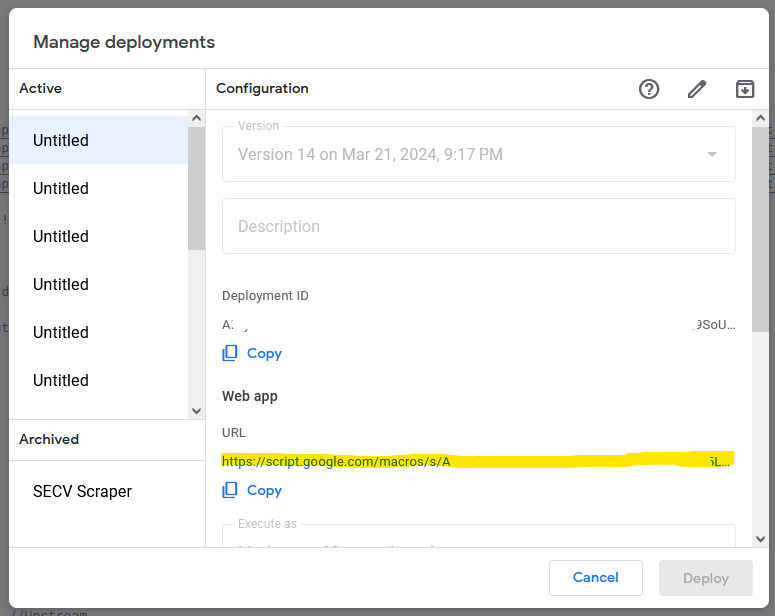
The main thing to understand here is that when this project is "deployed" we'll get a URL that we can send POST requests to and that this doPost() function is called when that happens.
/**
Request bandwidth usage page from PTD
Parse upstream, downstream, and total values from html
Add row to spreadsheet
Send quota alerts if needed
*/
function update(upload, download) {
  //var url = 'https://cable_company_bandwidth_graph_utility'

  //MAKE SURE TO COMMENT LINE 12 AND UN-COMMENT LINE 13 WHEN TESTING!!
  //var html = UrlFetchApp.fetch(url).getContentText()
  //var html = getTestHtml()

  //var parse = xmlDerps(html)    //This method no longer works, the deprecated methods it uses have finally been removed afaik
  //var parse = regexDerps(html)  //Garbage :)
  //var parse = regexDerpsv2(html)  //Fastest/Best. Regex is ugly, but when isn't regex ugly? :P

  var up = upload
  var down = download
  var tot = upload + download
This is the beginning of the main function in the sheet that used to run on a schedule. I've now commented out the code that used to fetch and parse the page and parameterized upload and download so that it can be called from within doPost() with the new values
The only missing piece now is code to run on my server to actually fetch/parse the data and send it on up to the sheet. I opted to do this in Python.
#!/usr/bin/env python3

from datetime import datetime
import json, re, requests

WEBHOOK_URL = "https://script.google.com/macros/s/WEBHOOK_ID/exec"
PTD_BANDWIDTH_GRAPH_URL = "https://cable_company_bandwidth_graph_utility"
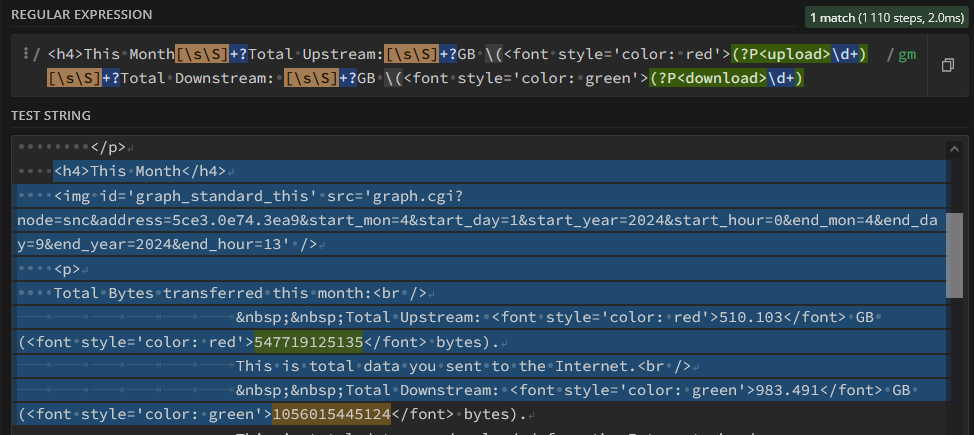
PATTERN = r"<h4>This Month[\s\S]+?Total Upstream:[\s\S]+?GB \(<font style='color: red'>(?P<upload>\d+)[\s\S]+?Total Downstream: [\s\S]+?GB \(<font style='color: green'>(?P<download>\d+)"

def fetch_webpage(url):
    try:
        response = requests.get(url)

        if response.status_code == 200:
            return response.text
        else:
            return f"Error: {response.status_code} - Unable to fetch webpage"
    except Exception as e:
        return f"Error: {str(e)} - Unable to fetch webpage"

html = fetch_webpage(PTD_BANDWIDTH_GRAPH_URL) # fetch page
matches = re.finditer(PATTERN, html) # run regex

data = []
for match in matches:
    data = [int(match.group('upload')), int(match.group('download'))] # regex grabs number of bytes

json_payload = json.dumps([data[0]/1024/1024/1024, data[1]/1024/1024/1024]) # bytes -> GB, divide values by 1,073,741,824
print('payload:', json_payload)
response = requests.post(WEBHOOK_URL, json=json_payload) # send JSON payload to Google Sheet

if response.status_code == 200:
    print("POST request successful.", response.text)
else:
    print("POST request failed:", response.status_code)
I've got this added to my crontab running hourly
And there we go; the original functionality of the Google Sheet is restored by using my server at home as a middle man to communicate with the cable company and Google Sheets. But that's not where I left it...
Going off the rails a bit
While discussing this with a friend (also a customer of the same cable company) he mentioned he'd like to have this data available in Home Assistant. He suggested using a Home Assistant add-on called pyscript. This is a very cool add-on and he did eventually get this working but I chose to roll my own API using Flask. I prefererd this approach because it would allow other tools to make use of this data.
Now, I could just write a Flask app that fetches and parses the bandwidth meter page and returns the values every time the end point is hit... Actually, I did do that initially, so that I could figure out how to configure the RESTful sensor in Home Assistant.
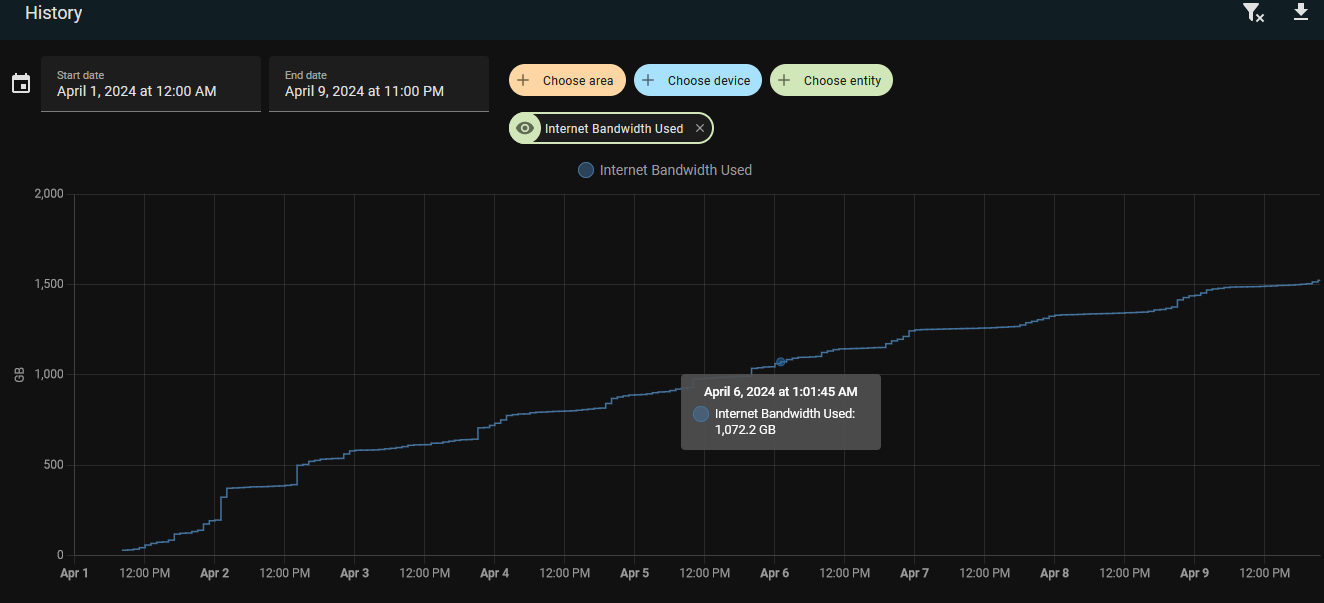
Touching a bit on Flask, JSON, and Home Assistant
@app.route('/bandwidth-GB', methods=['GET'])
def get_bandwidth_usage_GB():
    attributes = {}
    row = magical_function_that_gets_the_data_we_want_to_serve()
    attributes["timestamp"] = row[0]
    attributes["upstream"] = int(row[1])/1024/1024/1024
    attributes["downstream"] = int(row[2])/1024/1024/1024
    attributes["total"] = int(row[3])/1024/1024/1024
    return jsonify(attributes)

@app.route('/')
def hello_world():
    return '<h1>API is alive</h2>'

if __name__ == '__main__':
   app.run(host="0.0.0.0", port=5000)
Some pseudo-code to demonstrate the basic concepts of Flask
There is much much more to Flask than anything I'm about to relay to you, but the long and short of it are those @app.route() function decorators that allow you to associate an HTTP endpoint with a function. If we run the code above an HTTP server will be fired up on port 5000

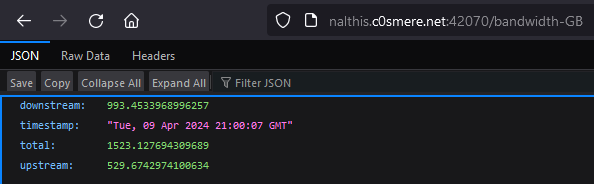
Now that the bare-minimum API is functioning lets look at the relevant Home Assistant configuration to create some sensors using this API as an example use case. The relevant documentation is here: Home Assistant - RESTful
rest:
  - scan_interval: 600
    resource: http://nalthis.c0smere.net:42070/bandwidth-GB
    sensor:
      - name: Internet Bandwidth Used
        value_template: "{{ value_json.total | round(3) }}"
        unit_of_measurement: GB
      - name: Internet Upstream Bandwidth Used
        value_template: "{{ value_json.upstream | round(3) }}"
        unit_of_measurement: GB
      - name: Internet Downstream Bandwidth Used
        value_template: "{{ value_json.downstream | round(3) }}"
        unit_of_measurement: GB
Relevant section added to my configuration.yml file to create three sensors using this new API
That's really just about it, the first time you add this to your config you do have to restart HA entirely for the sensors to be created.
Improving the API
I want to be respectful of the resource provided by the cable company, and by that I mean I want to make sure I'm not hammering their page with requests and being noticed. Initially, I modified the API script to store a timestamp of the last pull; if a request came in again before 60 minutes had elapsed the cached values from the last pull were returned. That would have worked just fine but I wanted more...
Circling back to the python script I'm running hourly via cron to insert data into the Google Sheet. I decided it was time to create a proper database and also store this information there. This will become the source of data that my API pulls from; it will always return the most recent data available and it doesn't matter how many requests I throw at it. The python script will add fresh data to it and the Google sheet hourly ensuring I'm not hitting the cable company's page more than once per hour.
docker run --name pgsql -e POSTGRES_PASSWORD=pa$$w0rd -d -v ${PWD}/db:/var/lib/postgresql/data -p 5432:5432 postgresSpinning up a Postgres container is fairly straightforward
I installed pgAdmin and created a general purpose database 'gp0' and a 'SECV_SCRAPE' schema within to use specifically for this project. I also created a service account with usage rights on only this schema because that's just good practice. Finally I needed a base table for the python script to insert data into:
CREATE TABLE IF NOT EXISTS "SECV_SCRAPE".scrape_data
(
    time_stamp timestamp without time zone NOT NULL,
    upstream bigint NOT NULL,
    downstream bigint NOT NULL,
    total bigint NOT NULL,
    CONSTRAINT scrape_data_pkey PRIMARY KEY (time_stamp)
)
The base table that drives the whole show. In hindsight I should have made the time_stamp column TZ aware...
With the database spun up the next steps were:
- Modify hourly python script to also insert data into the new table
- Modify the API to fetch the data from the new database and not the cable company page
The additions to the hourly script are fairly simple:
#!/usr/bin/env python3

from datetime import datetime
import json, re, requests, psycopg2

WEBHOOK_URL = "https://script.google.com/macros/s/webhook_id/exec"
PTD_BANDWIDTH_GRAPH_URL = "https://cable_company_graph_util"
PATTERN = r"<h4>This Month[\s\S]+?Total Upstream:[\s\S]+?GB \(<font style='color: red'>(?P<upload>\d+)[\s\S]+?Total Downstream: [\s\S]+?GB \(<font style='color: green'>(?P<download>\d+)"

db_params = {
    'dbname': 'gp0',
    'user': 'user',
    'password': 'pa$$w0rd',
    'host': '10.0.0.1',
    'port': '5432'
}

insert_query = """
    INSERT INTO "SECV_SCRAPE".scrape_data (time_stamp, upstream, downstream, total)
    VALUES (%s, %s, %s, %s)
"""

def log_to_database(up, down):
    tot = up + down
    data = [datetime.now(), up, down, tot]

    # Connect to the database using a context manager
    with psycopg2.connect(**db_params) as conn:
        with conn.cursor() as cursor:
            cursor.execute(insert_query, data)
        conn.commit()

def fetch_webpage(url):
    try:
        response = requests.get(url)

        if response.status_code == 200:
            return response.text
        else:
            return f"Error: {response.status_code} - Unable to fetch webpage"
    except Exception as e:
        return f"Error: {str(e)} - Unable to fetch webpage"

html = fetch_webpage(PTD_BANDWIDTH_GRAPH_URL) # fetch page
matches = re.finditer(PATTERN, html) # run regex

data = []
for match in matches:
    data = [int(match.group('upload')), int(match.group('download'))] # regex grabs number of bytes

log_to_database(data[0], data[1])

json_payload = json.dumps([data[0]/1024/1024/1024, data[1]/1024/1024/1024]) # convert to GB to send up to Google sheet
print('payload:', json_payload)
response = requests.post(WEBHOOK_URL, json=json_payload) # send JSON payload to Google Sheet

if response.status_code == 200:
    print("POST request successful.", response.text)
else:
    print("POST request failed:", response.status_code)
This is the version that is running hourly on my server right now
The modifications to the API are similar
import psycopg2
from flask import Flask, jsonify
from datetime import datetime

db_params = {
    'dbname': 'gp0',
    'user': 'user',
    'password': 'pa$$w0rd',
    'host': '10.0.0.1',
    'port': '5432'
}

select_query = """
    SELECT * FROM "SECV_SCRAPE".scrape_data
    ORDER BY time_stamp DESC
    LIMIT 1
"""

@app.route('/bandwidth-GB', methods=['GET'])
def get_bandwidth_usage_GB():
    attributes = {}
    with psycopg2.connect(**db_params) as conn:
        with conn.cursor() as cursor:
            cursor.execute(select_query)
            rows = cursor.fetchall()
            for row in rows:
                attributes["timestamp"] = row[0]
                attributes["upstream"] = int(row[1])/1024/1024/1024
                attributes["downstream"] = int(row[2])/1024/1024/1024
                attributes["total"] = int(row[3])/1024/1024/1024
    return jsonify(attributes)

@app.route('/')
def hello_world():
    return '<h1>API is alive</h2>'

if __name__ == '__main__':
   app.run(host="0.0.0.0", port=5000)
Here I've replace magical_function_that_gets_the_data_we_want_to_serve() from the pseudo code above with some code to query the new database for the data to send back
With the API in a functional state I wanted to get it deployed to my server so I created a docker file so I could run it in a container.
# syntax=docker/dockerfile:1

FROM python:3.9.19-alpine3.19

WORKDIR /python-docker

COPY requirements.txt requirements.txt
RUN pip3 install -r requirements.txt

COPY . .

CMD [ "python3", "-m" , "flask", "run", "--host=0.0.0.0"]
I also threw together a shell script to automatically stop and delete the running container (if there is one) and rebuild and start a new one to make pushing changes a lot less of a pain in the ass.
sudo docker rm $(docker stop $(docker ps -a -q --filter="name=magical_blackburn" --format="{{.ID}}"))
sudo docker build -t secv-api .
sudo docker run --name magical_blackburn -dp 42070:5000 secv-api
"magical_blackburn" was the auto-generated container name from the first time I ran this during testing and I decided to just go with it
What else can I do with this?
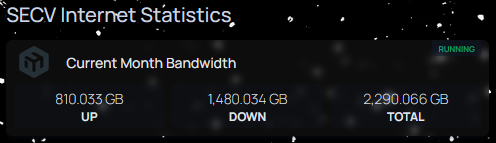
Adding a widget to my server dashboard
I use hompage for my server dashboard. There is support for Custom API widgets built in.
- SECV Internet Statistics:
    - Current Month Bandwidth:
        icon: mikrotik
        server: my-docker
        container: magical_blackburn
        widget:
          type: customapi
          url: http://192.168.88.5:42070/bandwidth-GB
          refreshInterval: 600000
          method: GET
          mappings:
            - field: upstream
              label: Up
              format: float
              suffix: GB
            - field: downstream
              label: Down
              format: float
              suffix: GB
            - field: total
              label: Total
              format: float
              suffix: GB
Relevant custom API widget configuration for my dashboard
Calculating a bunch of useless statistics and creating additional API endpoints for them
One thing my sheet used to do was calculate how much bandwidth was used since the previous run.

The first 4 columns are what's being supplied by the API at this point. Columns D, E, and F represent the change in each value since the previous pull. Anyone that's used a spreadsheet before can probably guess how I accomplished this in Google Sheets, but the data now resides in a relational database which is a lot more powerful but a different approach is required.
Taking a step back to think about what needs to happen; assuming the data is formatted by the time stamp column in descending order, to get the delta you just need to subtract the values from row (n-1) for any row n (excepting the very first one, and also rows where row(n-1) and row(n) occur in different months because the meter resets).
With that in mind, first it would be nice to have a "row number" column. This is very easy to do and you can even specify how you want the row numbers doled out i.e. "number the rows by time stamp in descending order"
SELECT row_number() OVER (ORDER BY scrape_data.time_stamp DESC) AS row_number,
            scrape_data.time_stamp,
            scrape_data.upstream,
            scrape_data.downstream,
            scrape_data.total
FROM "SECV_SCRAPE".scrape_data
The resulting data set looks like this:
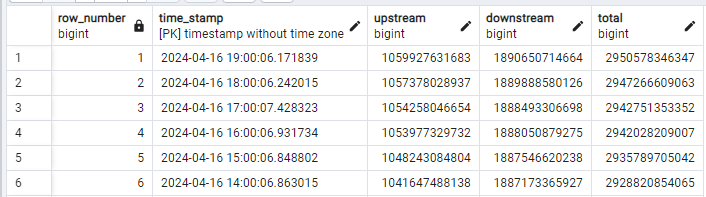
So my approach is to take two copies of this table (including the new row numbers) and join them together on table_A.row = table_B.row-1
Here's a crappy visual I mocked up in Google Sheets to illustrate the concept:

In this new dataset you could subtract the "green" upstream value from the "blue" upstream value to figure out how much upstream bandwidth was used during that period and this is exactly what my scrape intervals view is doing.
Here is what the final view looks like, code below
| period_start | period_end | duration | u_diff | d_diff | t_diff | u_rate | d_rate | t_rate |
|---|---|---|---|---|---|---|---|---|
| 2024-04-16 20:00:07 | 2024-04-16 21:00:07 | 1:00:00 | 4528332190 | 51049516828 | 55577849018 | 1257868.968 | 14180409.11 | 15438278.07 |
| 2024-04-16 19:00:06 | 2024-04-16 20:00:07 | 1:00:01 | 4373371799 | 1564825002 | 5938196801 | 1214559.052 | 434578.2746 | 1649137.326 |
| 2024-04-16 18:00:06 | 2024-04-16 19:00:06 | 1:00:00 | 2549602746 | 762134538 | 3311737284 | 708236.7909 | 211708.1652 | 919944.9561 |
| 2024-04-16 17:00:07 | 2024-04-16 18:00:06 | 0:59:59 | 3119982283 | 1395273428 | 4515255711 | 866947.4305 | 387703.7122 | 1254651.143 |
| 2024-04-16 16:00:07 | 2024-04-16 17:00:07 | 1:00:00 | 280716922 | 442427423 | 723144345 | 77966.16802 | 122879.5562 | 200845.7242 |
WITH a
     AS (SELECT Row_number()
                  over (
                    ORDER BY scrape_data.time_stamp DESC) AS row_number,
                scrape_data.time_stamp,
                scrape_data.upstream,
                scrape_data.downstream,
                scrape_data.total
         FROM   "SECV_SCRAPE".scrape_data),
     b
     AS (SELECT Row_number()
                  over (
                    ORDER BY scrape_data.time_stamp DESC) AS row_number,
                scrape_data.time_stamp,
                scrape_data.upstream,
                scrape_data.downstream,
                scrape_data.total
         FROM   "SECV_SCRAPE".scrape_data)
SELECT b.time_stamp                                                         AS
       period_start,
       a.time_stamp                                                         AS
       period_end,
       a.time_stamp - b.time_stamp                                          AS
       duration,
       a.upstream - CASE
                      WHEN To_char(b.time_stamp, 'MM' :: text) <>
                           To_char(a.time_stamp, 'MM' :: text) THEN 0 :: bigint
                      ELSE b.upstream
                    END                                                     AS
       u_diff,
       a.downstream - CASE
                        WHEN To_char(b.time_stamp, 'MM' :: text) <>
                             To_char(a.time_stamp, 'MM' :: text) THEN 0 ::
                        bigint
                        ELSE b.downstream
                      END                                                   AS
       d_diff,
       a.total - CASE
                   WHEN To_char(b.time_stamp, 'MM' :: text) <>
                        To_char(a.time_stamp, 'MM' :: text) THEN 0 :: bigint
                   ELSE b.total
                 END                                                        AS
       t_diff,
       ( a.upstream - CASE
                        WHEN To_char(b.time_stamp, 'MM' :: text) <>
                             To_char(a.time_stamp, 'MM' :: text) THEN 0 ::
                        bigint
                        ELSE b.upstream
                      END ) :: NUMERIC / Extract(epoch FROM a.time_stamp -
                                         b.time_stamp)                      AS
       u_rate,
       ( a.downstream - CASE
                          WHEN To_char(b.time_stamp, 'MM' :: text) <>
                               To_char(a.time_stamp, 'MM' :: text) THEN 0 ::
                          bigint
                          ELSE b.downstream
                        END ) :: NUMERIC / Extract(epoch FROM a.time_stamp -
                                                              b.time_stamp) AS
       d_rate,
       ( a.total - CASE
                     WHEN To_char(b.time_stamp, 'MM' :: text) <>
                          To_char(a.time_stamp, 'MM' :: text) THEN 0 :: bigint
                     ELSE b.total
                   END ) :: NUMERIC / Extract(epoch FROM a.time_stamp -
                                                         b.time_stamp)
                                                             AS t_rate
FROM   a
       join b
         ON ( a.row_number + 1 ) = b.row_number;
At the beginning you'll notice two CTEs A and B these are the two copies of the scrape_data table with a row number column added that are being joined together offset by 1 to generate the interval rows. All of the eyesore CASE statements are to handle the first pull of a new month when the counters reset.
What can I do with this?
I initially built this into the original spreadsheet so I could evaluate how much bandwidth I used for a given period; the old script ran every 12 hours so I'd calculate a percentage based on a hypothetical quota for 12 hours (ex. 4000GB / 730.5 hours in a month * 12 = 65.7GB).
I don't have a cap anymore so I thought it would be interesting to compute some usage statistics on a rolling 24 hour basis. I know my script is running hourly barring any errors or downtime so it would be "good enough" to just pull the most recent 24 rows from the view I detailed above each time a row is inserted into the main table and compute the statistics over that. Of course, downtime happens and it would be much cooler to be able to account for that. In simplest terms the code needs to be able to only aggregate as many rows from the view as it needs to add up to 24 hours; here's how I did it.
Similar to adding a row number to the data set when creating the view detailed above I added a cumulative sum of the duration column using a window function.
SELECT extract('epoch' FROM SUM(duration) OVER (ORDER BY period_start DESC)) AS x
       ,*
FROM "SECV_SCRAPE".scrape_data_intervals
| x | period_start | period_end | duration |
|---|---|---|---|
| 3601 | 2024-04-16 21:00:07 | 2024-04-16 22:00:08 | 1:00:01 |
| 7201 | 2024-04-16 20:00:07 | 2024-04-16 21:00:07 | 1:00:00 |
| 10802 | 2024-04-16 19:00:06 | 2024-04-16 20:00:07 | 1:00:01 |
| 14402 | 2024-04-16 18:00:06 | 2024-04-16 19:00:06 | 1:00:00 |
| 18000 | 2024-04-16 17:00:07 | 2024-04-16 18:00:06 | 0:59:59 |
You can select rows for any arbitrary time period by filtering the x column to the desired duration in seconds making sure to leave some room for overshoot:
WITH cte as (
SELECT extract('epoch' FROM SUM(duration) OVER (ORDER BY period_start DESC)) AS x
      ,*
    FROM "SECV_SCRAPE".scrape_data_intervals
)
SELECT *
FROM cte
where x < 87300; -- 24.25 hours in seconds, to allow for some overshoot because of varying execution times
This query now returns whatever rows are required to represent the most recent 24 hour period when run so I added all of my statistical analysis to that and actually wrapped this code up into a trigger function that inserts these stats into a new table "SECV_SCRAPE".rolling_24hr_summary. This trigger function is called whenever a row is inserted into the main table by the python script.
This is what the data looks like in the new table
| period_start | period_end | duration | u_diff | d_diff | t_diff | u_rate | d_rate | t_rate | cap_bytes | pct_cap_util |
|---|---|---|---|---|---|---|---|---|---|---|
| 2024-04-15 22:00:07 | 2024-04-16 22:00:08 | 24:00:01 | 60798053410 | 95635839965 | 156433893375 | 703671.4936 | 1106881.069 | 1810552.563 | 214751319004 | 72.84% |
| 2024-04-15 21:00:07 | 2024-04-16 21:00:07 | 24:00:00 | 67731653919 | 95809674441 | 163541328360 | 783930.7066 | 1108907.6 | 1892838.306 | 214748494387 | 76.15% |
| 2024-04-15 20:00:07 | 2024-04-16 20:00:07 | 24:00:00 | 67026553967 | 47238579138 | 114265133105 | 775772.0194 | 546744.0255 | 1322516.045 | 214747888986 | 53.21% |
| 2024-04-15 19:00:07 | 2024-04-16 19:00:06 | 24:00:00 | 63720461365 | 47514693228 | 111235154593 | 737509.0211 | 549941.324 | 1287450.345 | 214747292907 | 51.80% |
| 2024-04-15 18:00:07 | 2024-04-16 18:00:06 | 23:59:59 | 61685365375 | 51139735624 | 112825100999 | 713956.2335 | 591899.4368 | 1305855.67 | 214746787078 | 52.54% |
BEGIN
WITH cte AS (
    SELECT *
          ,extract('epoch' FROM SUM(duration) OVER (ORDER BY period_start DESC)) AS x
    FROM "SECV_SCRAPE".scrape_data_intervals
    )
INSERT INTO "SECV_SCRAPE".rolling_24hr_summary
SELECT MIN(period_start) AS period_start
      ,MAX(period_end) AS period_end
      ,SUM(duration) AS duration
      ,SUM(u_diff) AS u_diff
      ,SUM(d_diff) AS d_diff
      ,SUM(t_diff) AS t_diff
      ,SUM(u_diff)/extract('epoch' FROM SUM(duration)) AS u_rate
      ,SUM(d_diff)/extract('epoch' FROM SUM(duration)) AS d_rate
      ,SUM(t_diff)/extract('epoch' FROM SUM(duration)) AS t_rate
	  ,(((((MAX(cap.cap_bytes)/extract(days FROM date_trunc('month', MIN(period_start)) + interval '1 month - 1 day'))/24)/60)/60) * extract('epoch' FROM SUM(duration))) AS cap_bytes
	  ,SUM(t_diff) / (((((MAX(cap.cap_bytes)/extract(days FROM date_trunc('month', MIN(period_start)) + interval '1 month - 1 day'))/24)/60)/60) * extract('epoch' FROM SUM(duration))) AS pct_cap_util
FROM cte
LEFT JOIN "SECV_SCRAPE".bandwidth_cap_history cap
	ON period_start BETWEEN cap.start_date and cap.end_date
WHERE x < 87300; -- 24.25 hours in seconds, to allow for some overshoot because of varying execution times
RETURN NEW;
END
Trigger function code to add statistics to the rolling_24hr_summary table
Creating an endpoint for this data
SELECT period_start
      ,period_end
      ,u_diff/1024.0/1024/1024 AS u_diff_GB
      ,d_diff/1024.0/1024/1024 AS d_diff_GB
      ,t_diff/1024.0/1024/1024 AS t_diff_GB
      ,u_rate/1024.0/1024 AS u_rate_MBs
      ,d_rate/1024.0/1024 AS d_rate_MBs
      ,t_rate/1024.0/1024 AS t_rate_MBs
      ,cap_bytes/1024.0/1024/1024 AS cap_GB
      ,pct_cap_util*100 AS pct_cap_util
FROM "SECV_SCRAPE".rolling_24hr_summary
ORDER BY period_end DESC
LIMIT 1
A query to grab the most recent rolling 24 hour stats in a human readable format for the new API endpoint
def generic_query(q):
    attributes = {}
    with psycopg2.connect(**db_params) as conn:
        with conn.cursor() as cursor:
            cursor.execute(q)
            rows = cursor.fetchall()
            col_names = [desc[0] for desc in cursor.description]

            for row in rows:
                for col_name, value in zip(col_names, row):
                    attributes[col_name] = value

    return jsonify(attributes)

@app.route('/rolling24', methods=['GET'])
def get_rolling_24_data():
    return generic_query(rolling_query)
By this point I abstracted the query running a little bit; the "generic_query" function returns a dictionary where the keys are the column names from the query result set.
Adding this data to my dashboard
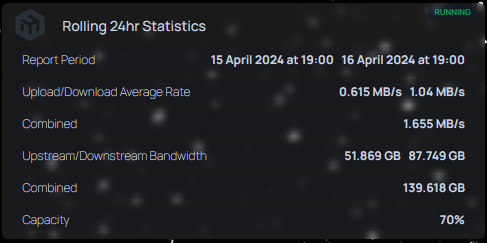
    - Rolling 24hr Statistics:
        icon: mikrotik
        server: my-docker
        container: magical_blackburn
        widget:
          type: customapi
          url: http://192.168.88.5:42070/rolling24
          refreshInterval: 600000
          method: GET
          display: list
          mappings:
            - field: period_start
              label: Report Period
              format: date
              locale: en-GB
              timeStyle: short
              additionalField:
                field: period_end
                label: end
                format: date
                locale: en-GB
                timeStyle: short
            - field: u_rate_mbs
              label: Upload/Download Average Rate
              format: float
              suffix: MB/s
              additionalField:
                field: d_rate_mbs
                label: Download
                format: float
                suffix: MB/s
            - field: t_rate_mbs
              label: Combined
              format: float
              suffix: MB/s
            - field: u_diff_gb
              label: Upstream/Downstream Bandwidth
              format: float
              suffix: GB
              additionalField:
                field: d_diff_gb
                label: Downstream
                format: float
                suffix: GB
            - field: t_diff_gb
              label: Combined
              format: float
              suffix: GB
            - field: pct_cap_util
              label: Capacity
              format: percent
Relevant homepage services.conf configuration
Wrapping Up
If you've made it this far seek professional help.
Anyway, this (actually writing all of this up) was an interesting exercise. I mostly just wanted to check out Ghost and I added this blog to my resume so I felt compelled to write at least one post. I've gained a lot of appreciation/respect for the authors of the thousands of blog posts I've consumed up until this point in my life that have taught me so much, saved me time and sanity, and entertained in general.
If nothing else I'll probably consult this post in the future when something inevitably breaks to remind myself what in the hell I was thinking when I wrote this.
Wes
Lightning Round
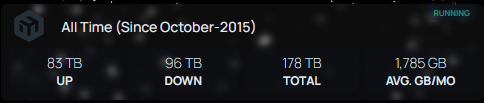
I did create another view where each row is a monthly total. I'm not going to go into gory details; I followed a similar pattern of using a window function to add a row number to the main data set (this time by time stamp descending partitioned by YYYY-MM of the time stamp. This ensures that the final record for any given month will have a row number of 1) and summarizing. I used this to create an "all time" endpoint which looks like this on my dashboard:
Thanks for reading.